
MLN is thrilled to unveil the beta premiere of our most exciting tool yet: Mortgage Command Centre (MCC).
The Mortgage Command Centre is a pilot's cockpit for anyone navigating Canada's mortgage market. Use it to quickly monitor rates, housing, and economic trends, and create data-based content that wows clients and referral sources.
MLN Pro members now have the superpower ability to:
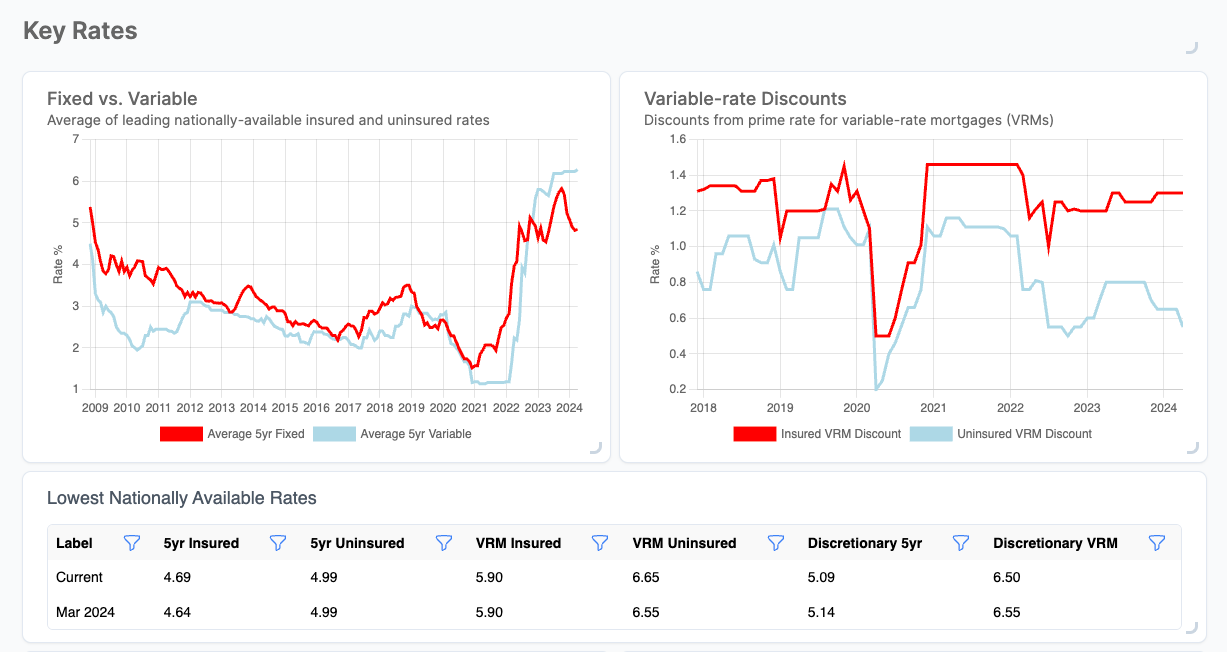
#1 - Monitor key market barometers all on one page
Watch multiple indicators for trends that may persist. Get a better sense of where rates or housing are going—beyond just the short term.
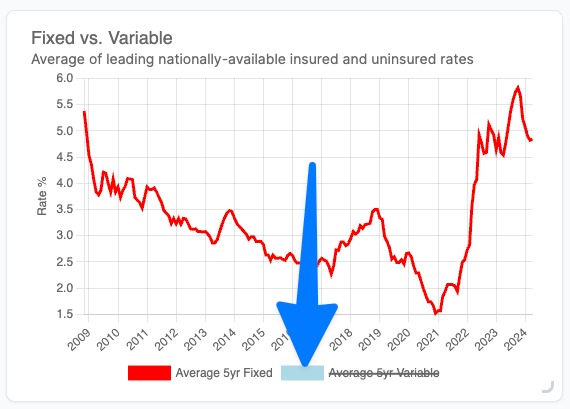
#2 - Share charts
MLN Pro members are free to copy the MLN charts for personal use or use in customer emails, public-facing content, social media or marketing. Sharing charts and data is subject only to attribution and the reasonable limitations below.
Pro tip: Click on a legend value to hide that data in the chart.
#3 - Download data
MLN Pro members get access to all publicly available data points in our database. Simply email us with the data you need, and we'll send you a spreadsheet file. Please note that some data is not available, such as 4-year swap data, historical #OIS# data, etc.
Data may be used for internal research and to create charts and analyses that you can send to clients and referral partners. (At this time, no other data use or distribution is permitted without MLN's advanced, explicit consent. Thank you for understanding.)
#4 - Ask the AI for help
What if you want a chart that doesn't exist?
Ask the AI to create it!
For example, in this box...

...try copying and pasting these instructions, for example:
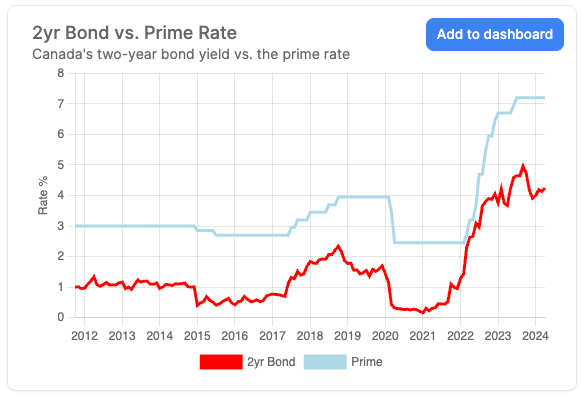
- Create a new line chart with two lines: one line for ‘2yr Bond’ in red and one line for ‘Prime’ in light blue.
- Use the “Date” column for the X-axis and strip any spaces in the date column before performing any operations on it.
- Show monthly data from October 2011 to the most recent data.
- Display the chart tooltip with the date format MMM YYYY.
- Make the Y-axis label read “Rate %”.
- Do not show a label on the X-axis.
- Show only whole number years on the X-axis, such as 2009, 2010, 2011, et cetera.
- Do not show points on the chart lines.
- Put the legend on the bottom of the chart.
- Make the most recent date appear on the X-axis.
- Make a large chart title that says “2yr Bond vs. Prime Rate” and then show a subtitle right below it that says “Canada's two-year bond yield vs. the prime rate”.
It should build you a chart that looks like this, which you can copy or download data from.
Pro tip: The AI requires precise instructions to generate charts. The above bullets can be used as a template. Here are all the fields we have data on.
Since this is a beta, any feedback, good, bad, or ugly, is much appreciated. Among the many things we're working on are adding more Bank of Canada metrics and creating the ability to customize your own dashboard.
Reminders
- All charts are monthly, but many of the most recent values are changed multiple times a week as new data comes in. For example, bond yields and mortgage rates are refreshed at the end of each day. CPI, home price and unemployment data are refreshed monthly as they are reported. Bookmark this page and check in regularly for the latest updates.
- When using MLN charts and data, we kindly ask they be attributed to "MortgageLogic.news" and linked to https://www.mortgagelogic.news if shared online.
- MCC data and charts are available only to current Pro members on a revokable license and are subject to the standard terms of service, which may change. Among other thing, those terms forbid:
- sharing or publishing of raw data — other than the most recent values — on other websites
- providing data access to non-MLN members
- charging others for MLN data, directly or indirectly, without MLN's specific written consent
- use of third-party data without the direct permission of that party.
- The MCC replaces MLN's prior Mortgage Market Database, which will be retired on June 1.
Just warming up
Today, MLN is unboxing MCC phase I. But many more data goodies are still to be unwrapped, so stay tuned.
The goal of this tool is to give you an ace up your sleeve for trend-spotting and generating applause-worthy insights.
In the meantime, if there's a critical national stat or graph you can't live without, shoot us a message in the comments below. We might be able to whip it up. Odds are, it's on our to-do list anyhow.